Tutorial
1.Junction data collection
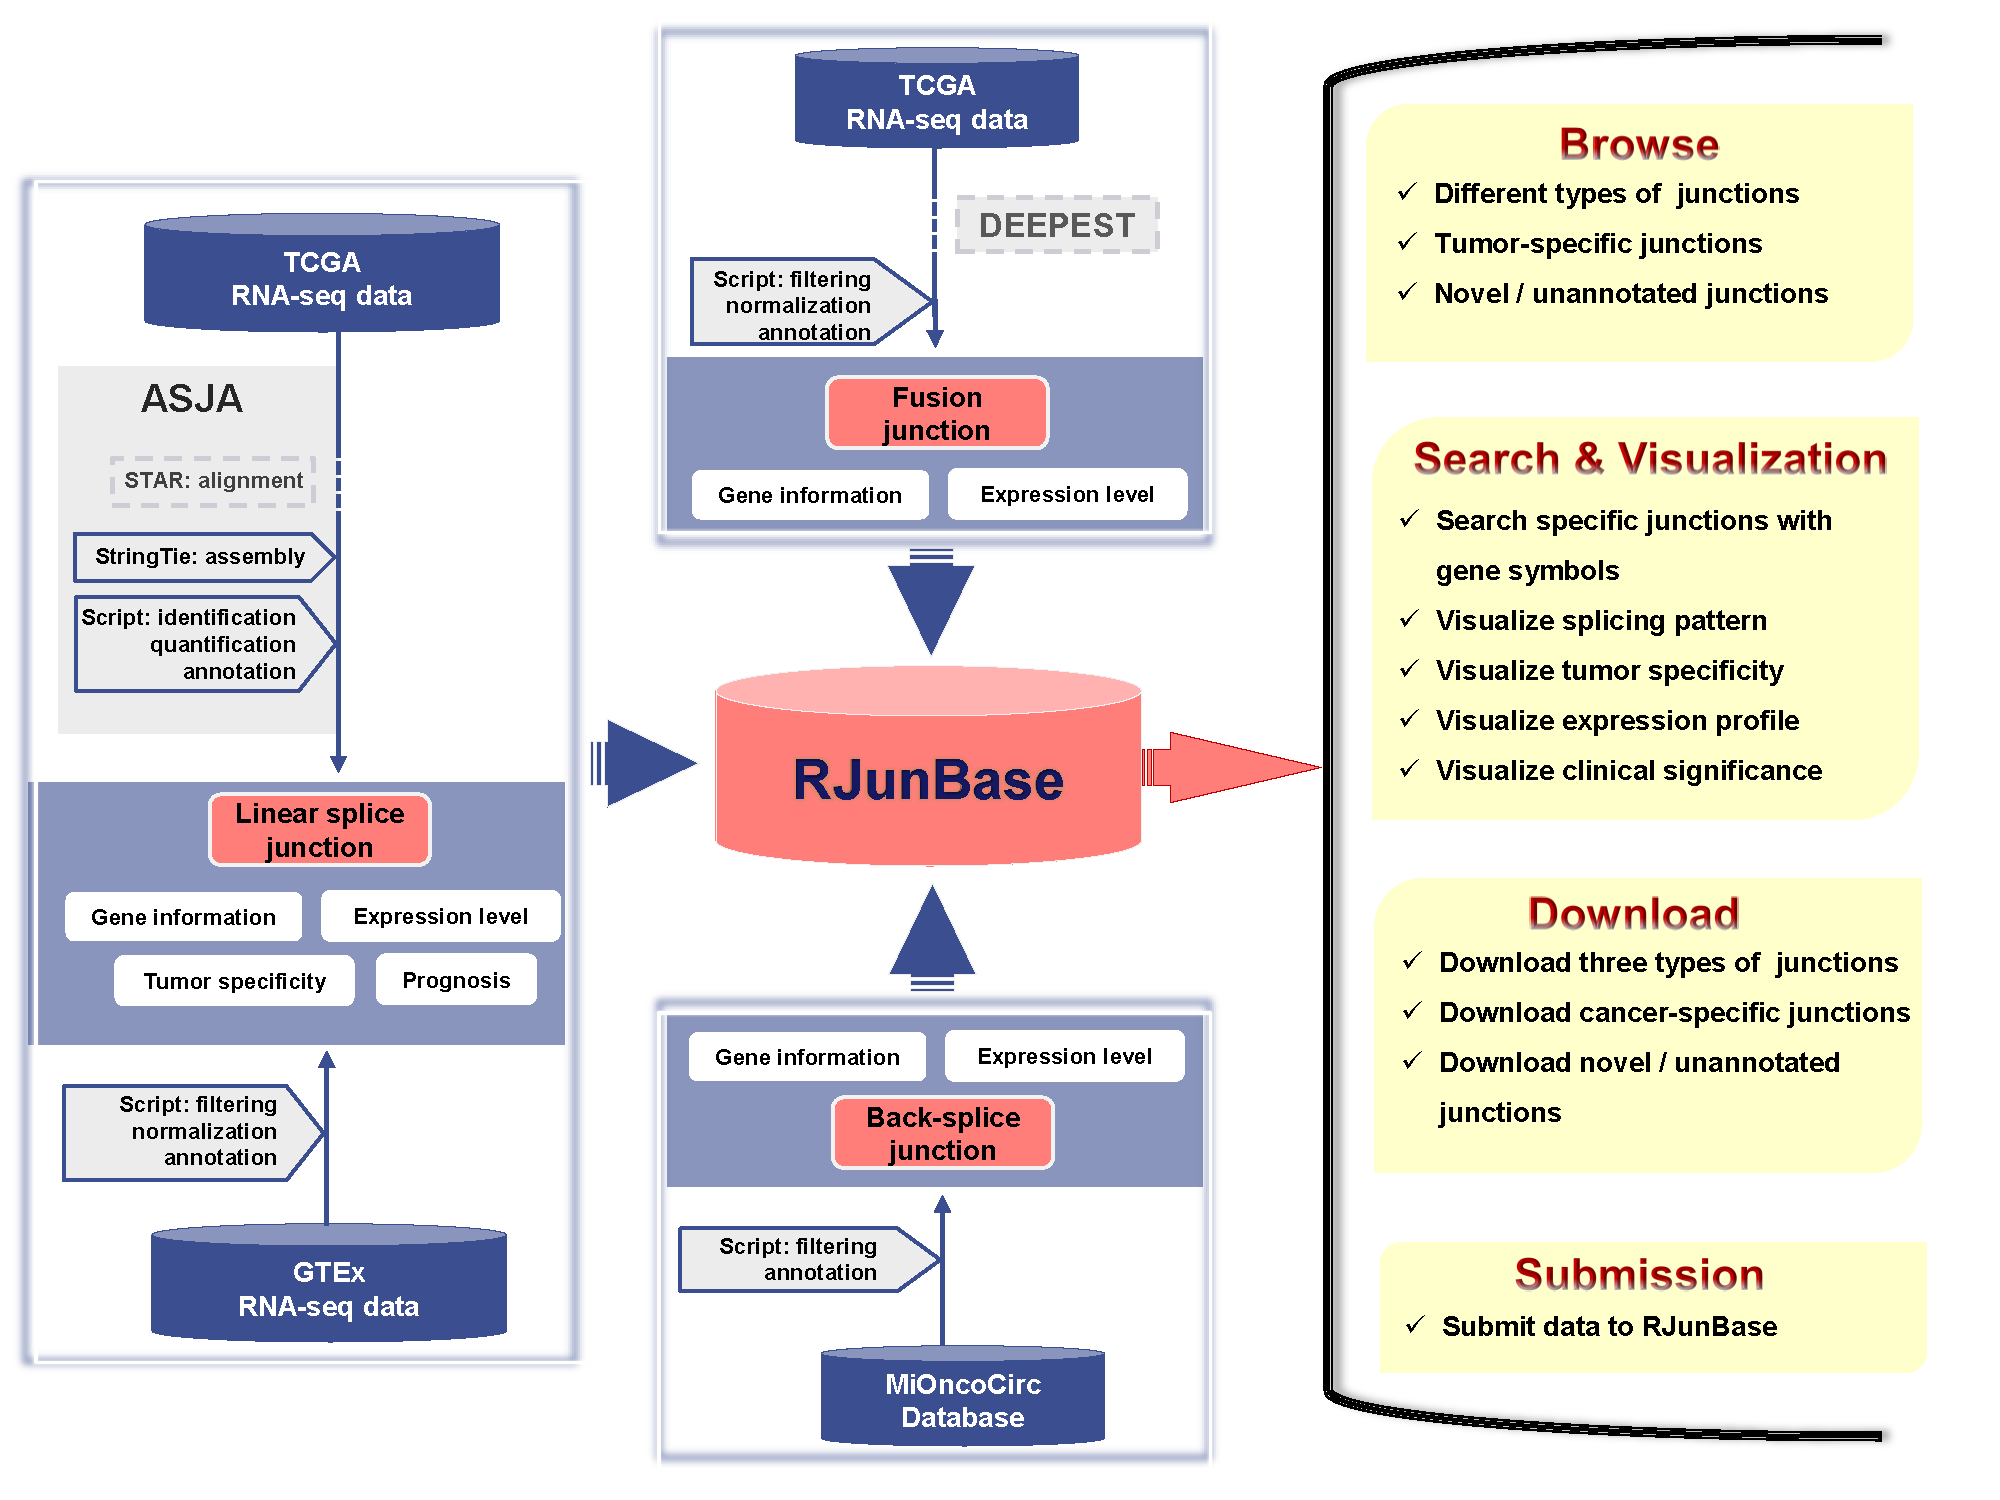
We downloaded RNA-seq data of 10,283 samples across 33 cancer types from The Cancer Genome Atlas (TCGA). Linear splice junctions were identified and quantified using Assembling Splice Junctions Analysis (ASJA). In addition, we also obtained linear splice junctions from GTEx datasets. The back-splice junctions were collected from MiOncoCirc across 27 cancer types, and samples for which the total back-splice counts were less than 1000 were removed. Fusion junctions were download from a previous work published by Dehghannasiri et al.
2.Browse RJunBase
The database can be browsed for junctions by clicking the “Browse” tab on the left-side navigation menu, and the browse page represents the entry point to tables containing all the information on the three kind of junctions. Users can browse the RJunBase database with various options. The “Junction type” allows users to browse junctions of interest, such as fusion junctions. The “Gene type” denotes the type of hosting gene of each junction, such as “protein coding”. If not selected, junctions from all types of genes will be displayed. For fusion junctions, the hosting genes, such as protein coding genes, are connected by “-”. RJunBase also provides two options to screen potentially functional junctions: “Annotation” indicates whether selected junctions can be extracted from Genecode; “Tumor-specific types” denotes whether the junctions currently being browsed are tumor-specific. RJunBase includes tumor-specific junctions from 33 cancer types from TCGA.
3.Search RJunBase
The home page of the website provides a quick search utility which can be used to query the database for the genes of interest. RJunBase also provides a simple search interface. Users can enter one or more gene symbols (e.g. ERBB2; ETV4, FGFR2) separated by commas in the “Keyword Search” field to search for a gene of interest. Advanced filters allow the user to further filter based on Junction type, Annotation, Tumor-specific types, and Genomic location
4.Search results
Clicking the “Search” button will lead to the basic information of all junctions belonging to input gene. “Search Results” include “Splicing pattern chart” and responsive tables. “Splicing pattern chart” displays visualizations of those junctions in the gene. Clicking the “Linear&Back” button rapidly plots all linear-splice and back-splice junctions, with exon information from the ref gtf file in a publication-quality format. “Fusion” will provide the circos plot of fusion splice junctions between two hosting genes. If fusion splice junctions do not exist in the host gene, the “Fusion” button will not be displayed. Responsive tables provide the annotation and expression information of three kind of junctions. It should be noted that “Alternative splicing types” column in responsive tables only displays the alternative splicing type the junction was involved. Alternative splicing events cannot be attributed to a single splice junction, and it should be a result of alternative splice junctions usage. The complete information that contains type of alternative splicing events and all involved junctions was provided in download page as “Alternative splice junctions”. Clicking on the JunctionID hyperlinks will lead users to a page containing detailed information about the corresponding junctions.
5.Junction detail
Users can obtain basic junction annotations in the summary page. The “Expression profile” button will lead to the expression profile of the input junction across all tumor and normal tissues in boxplots. “Boxplot” dynamically plots expression profiles of a given junction according to user-defined cancer selections and methods. RJunBase performs survival analysis based on junction expression levels. This function allows users to select their custom cancer types for overall or disease-free survival analysis. For example, to examine the survival curves of an input junction in liver cancer, users can select liver hepatocellular carcinoma (LIHC) for survival analysis. RJunBase uses the Kaplan-Meier method for hypothesis evaluation. The thresholds for high/low expression level cohorts can be adjusted.
6.Description of columns
7.Download data and Contact us
Users can freely download the data in RJunBase database, including the gene annotation information and expression profiles for linear, back-splice and fusion junctions, especially the novel / unannotated an tumor-specific junctions. The links are provided in the
download page.
To improve RJunBase, we welcome any questions and suggestions regarding the development or usage of this database, please contact us:
slhuang@fudan.edu.cn
. In addition, we offer data submission in the
contact page, please upload your junction data.